Product docs and API reference are now on Akamai TechDocs.
Search product docs.
Search for “” in product docs.
Search API reference.
Search for “” in API reference.
Search Results
results matching
results
No Results
Filters
How to Install and Configure Prometheus and Grafana on Ubuntu
Traducciones al EspañolEstamos traduciendo nuestros guías y tutoriales al Español. Es posible que usted esté viendo una traducción generada automáticamente. Estamos trabajando con traductores profesionales para verificar las traducciones de nuestro sitio web. Este proyecto es un trabajo en curso.
Most administrators want to have a comprehensive overview of how their servers are performing. Having visibility of server CPU, memory, and I/O statistics helps them discover and isolate issues before they can cause problems. Prometheus offers a robust node monitoring solution for collecting useful statistics from client nodes. In conjunction with the Grafana visualization solution, Prometheus allows users to visually monitor core server statistics.
What is Prometheus?
Prometheus is an open-source system monitoring application that collects server metrics at regular intervals. It can monitor its host server as well as external clients. Prometheus enables external performance monitoring for all clients, allowing for early detection of possible errors or unexpected behavior. Each client must run a metrics collation tool known as an exporter to collect and expose its internal statistics. For security reasons, Prometheus cannot monitor an external node that is not collecting data in this manner.
The Prometheus server uses the HTTP protocol to poll the client servers for the required data. It maintains a time-series database of the results, polling each client at a predefined interval. Prometheus stores the discrete snapshots along with the timestamps indicating when the statistics were retrieved. Prometheus retains the metrics it collects, allowing it to build an overview of the long-term performance of the client.
Although various statistic collectors can be used on the client nodes, Prometheus recommends its own Node Exporter tool. Prometheus Node Exporter collects a large number of hardware and kernel metrics, including CPU and memory use. A full list of the available metrics collected can be found on the Node Exporter GitHub page. Node Exporter is closely integrated with Prometheus and shares the same data format. No conversion or pre-processing work is required to use Node Exporter and Prometheus together. Node Exporter should be installed on every client to monitor. Node Exporter uses port 9100, while Prometheus uses port 9090. For more information on Prometheus, see the Prometheus Documentation.
Some additional features of Prometheus are as follows.
- It is open source and independent of any company
- Each Prometheus server is autonomous and does not require distributed storage or a central server
- It is highly reliable and easy to install
- Different clients can be polled at different intervals
- It uses a flexible multi-dimensional data model with support for time-series data and key-value pairs
- It supports the PromQL query language for retrieving and analyzing data
- It includes the AlertManger component. AlertManager receives alerts from clients and pushes them out to different subscribers
- Prometheus can feed its metrics into visualization tools such as Grafana
- The optional Prometheus PushGateway supports the push-based metric collection
- It is customizable and supports third-party libraries
- It supports Docker containerization and Kubernetes
- Prometheus has a large and active developer and user community
What is Grafana?
Grafana is a visualization application available in both open-source and enterprise editions. Grafana does not collect any metrics from the clients and it does not store any data. Instead, the Grafana user interface displays the metrics collected by Prometheus or another data source in an intuitive and visually-appealing format. Grafana presents the data using a dashboard. A dashboard is a template to define the values to display and how to display them. Most dashboards provide additional options, allowing users to exercise more control over the presentation.
Grafana supports a wide range of dashboards, including the Prometheus Node Exporter dashboard. Grafana features the approved dashboards in the Grafana Dashboard Library. It also allows users to create their own panels and run their own queries on a data source. Grafana can also connect to SQL or NoSQL databases, and incident ticket applications such as Jira, and GitLab. Multiple data sources can be integrated within the same dashboard.
Grafana supports alerts, annotations, dashboard variables, plugins, and authentication. It also provides a range of analytics tools to further deconstruct the data. The Grafana web interface can be accessed using port 3000 of the host server. For best results, run Prometheus and Grafana on the same server. For more background information, see the Introduction to Grafana.
Marketplace App
Installing a complete Prometheus and Grafana-based system is a multi-step process. To streamline deployments, you can use the Prometheus and Grafana Marketplace App. For a more traditional and hands-on deployment, follow the instructions below.
Before You Begin
If you have not already done so, create a Linode account and Compute Instance. See our Getting Started with Linode and Creating a Compute Instance guides.
Follow our Setting Up and Securing a Compute Instance guide to update your system. You may also wish to set the timezone, configure your hostname, create a limited user account, and harden SSH access.
Prometheus requires 4GB of memory and 20GB of disk space and works best with at least two CPU cores.
In most cases, Prometheus and Grafana are used to monitor external servers. To duplicate the configuration in this guide, create and set up a second Linode Compute Instance to use as a client.
sudo. If you are not familiar with the sudo command, see the
Linux Users and Groups guide.How to Install and Configure Prometheus, Grafana, and Node Exporter
In these instructions, the system hosting the Prometheus server is referred to as the “monitoring server”. The system being monitored is a “client”. It is possible to develop very complicated custom exporters and dashboards using Prometheus and Grafana. However, this guide describes a more straightforward solution for monitoring the most critical client details, including CPU, memory, and I/O usage. It does not require any knowledge of PromQL or any low-level details for either Prometheus or Grafana.
To configure the end-to-end solution, the following steps are required.
- Download and install Prometheus on the monitoring system.
- Configure Prometheus to run as a service.
- Install Node Exporter on all clients.
- Configure Prometheus to monitor the clients.
- Install and deploy the Grafana server.
- Integrate Grafana and Prometheus.
- Import a Dashboard for the Node Exporter Statistics.
This guide is designed for Ubuntu 22.04 LTS users but is generally applicable to the most recent Ubuntu releases.
How to Download and Install Prometheus
Prometheus can be downloaded as a precompiled binary from the GitHub repository. The Prometheus Downloads repository lists the most recent release of Prometheus. The Prometheus GitHub page also provides instructions on how to build Prometheus from the source code or run it as a Docker container. To download Prometheus, follow these steps.
Visit the Prometheus downloads and make a note of the most recent release. The most recent LTS release is clearly indicated on the site.
Use
wgetto download Prometheus to the monitoring server. The target link has the formathttps://github.com/prometheus/prometheus/releases/download/v[release]/prometheus-[release].linux-amd64.tar.gz. Replace the string[release]with the actual release to download. For example, the following command downloads release2.37.6.wget https://github.com/prometheus/prometheus/releases/download/v2.37.6/prometheus-2.37.6.linux-amd64.tar.gzExtract the archived Prometheus files.
tar xvfz prometheus-*.tar.gz(Optional) After the files have been extracted, delete the archive or move it to a different location for storage.
rm prometheus-*.tar.gzCreate two new directories for Prometheus to use. The
/etc/prometheusdirectory stores the Prometheus configuration files. The/var/lib/prometheusdirectory holds application data.sudo mkdir /etc/prometheus /var/lib/prometheusMove into the main directory of the extracted
prometheusfolder. Substitute the name of the actual directory in place ofprometheus-2.37.6.linux-amd64.cd prometheus-2.37.6.linux-amd64Move the
prometheusandpromtooldirectories to the/usr/local/bin/directory. This makes Prometheus accessible to all users.sudo mv prometheus promtool /usr/local/bin/Move the
prometheus.ymlYAML configuration file to the/etc/prometheusdirectory.sudo mv prometheus.yml /etc/prometheus/prometheus.ymlThe
consolesandconsole_librariesdirectories contain the resources necessary to create customized consoles. This feature is more advanced and is not covered in this guide. However, these files should also be moved to theetc/prometheusdirectory in case they are ever required.Note After these directories are moved over, only theLICENSEandNOTICEfiles remain in the original directory. Back up these documents to another location and delete theprometheus-releasenum.linux-amd64directory.sudo mv consoles/ console_libraries/ /etc/prometheus/Verify that Prometheus is successfully installed using the below command:
prometheus --versionprometheus, version 2.37.6 (branch: HEAD, revision: 8ade24a23af6be0f35414d6e8ce09598446c29a2) build user: root@5f96027a7c3e build date: 20230220-09:36:40 go version: go1.19.6 platform: linux/amd64
How to Configure Prometheus as a Service
Although Prometheus can be started and stopped from the command line, it is more convenient to run it as a service using the systemctl utility. This allows it to run in the background.
Before Prometheus can monitor any external systems, additional configuration details must be added to the prometheus.yml file. However, Prometheus is already configured to monitor itself, allowing for a quick sanity test. To configure Prometheus, follow the steps below.
Create a
prometheususer. The following command creates a system user.sudo useradd -rs /bin/false prometheusAssign ownership of the two directories created in the previous section to the new
prometheususer.sudo chown -R prometheus: /etc/prometheus /var/lib/prometheusTo allow Prometheus to run as a service, create a
prometheus.servicefile using the following command:sudo vi /etc/systemd/system/prometheus.serviceEnter the following content into the file:
- File: /etc/systemd/system/prometheus.service
1 2 3 4 5 6 7 8 9 10 11 12 13 14 15 16 17 18 19 20 21 22[Unit] Description=Prometheus Wants=network-online.target After=network-online.target [Service] User=prometheus Group=prometheus Type=simple Restart=on-failure RestartSec=5s ExecStart=/usr/local/bin/prometheus \ --config.file /etc/prometheus/prometheus.yml \ --storage.tsdb.path /var/lib/prometheus/ \ --web.console.templates=/etc/prometheus/consoles \ --web.console.libraries=/etc/prometheus/console_libraries \ --web.listen-address=0.0.0.0:9090 \ --web.enable-lifecycle \ --log.level=info [Install] WantedBy=multi-user.target
- The
WantsandAfteroptions must be set tonetwork-online.target. - The
UserandGroupfields must both be set toprometheus. - The
ExecStartparameter explains where to find theprometheusexecutable and defines the default options. - The
config.fileoption defines the location of the Prometheus configuration file as/etc/prometheus/prometheus.yml. storage.tsdb.pathtells Prometheus to store application data in the/var/lib/prometheus/directory.web.listen-addressis set to0.0.0.0:9090, allowing Prometheus to listen for connections on all network interfaces.- The
web.enable-lifecycleoption allows users to reload the configuration file without restarting Prometheus.
Reload the
systemctldaemon.sudo systemctl daemon-reload(Optional) Use
systemctl enableto configure theprometheusservice to automatically start when the system boots. If this command is not added, Prometheus must be launched manually.sudo systemctl enable prometheusStart the
prometheusservice and review thestatuscommand to ensure it isactive.Note If theprometheusservice fails to start properly, run the commandjournalctl -u prometheus -f --no-pagerand review the output for errors.sudo systemctl start prometheus sudo systemctl status prometheusprometheus.service - Prometheus Loaded: loaded (/etc/systemd/system/prometheus.service; enabled; vendor preset: enabled) Active: active (running) since Mon 2023-04-10 13:06:50 UTC; 7s agoAccess the Prometheus web interface and dashboard at
http://local_ip_addr:9090. Replacelocal_ip_addrwith the address of the monitoring server. Because Prometheus is using the default configuration file, it does not display much information yet.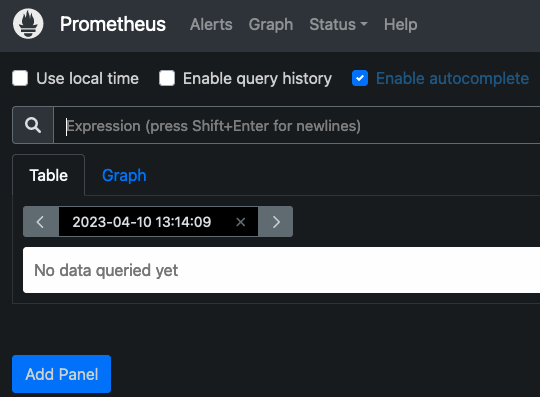
The default
prometheus.ymlfile contains a directive to scrape the local host. Click Status and Targets to list all the targets. Prometheus should display the local Prometheus service as the only target.
How to Install and Configure Node Exporter on the Client
Before a remote system can be monitored, it must have some type of client to collect the statistics. Several third-party clients are available. However, for ease of use, Prometheus recommends the Node Exporter client. After Node Exporter is installed on a client, the client can be added to the list of servers to scrape in prometheus.yml.
To install Node Exporter, follow these steps. Repeat these instructions for every client.
9100. This port is accessible on the internet and anyone running Prometheus elsewhere can potentially collect them. If you are using a firewall, you must open port 9100 using the command sudo ufw allow 9100.Consult the Node Exporter section of the Prometheus downloads page and determine the latest release.
Use
wgetto download this release. The format for the file ishttps://github.com/prometheus/node_exporter/releases/download/v[release_num]/node_exporter-[release_num].linux-amd64.tar.gz. Replace[release_num]with the number corresponding to the actual release. For example, the following example demonstrates how to download Node Exporter release1.5.0.wget https://github.com/prometheus/node_exporter/releases/download/v1.5.0/node_exporter-1.5.0.linux-amd64.tar.gzExtract the application.
tar xvfz node_exporter-*.tar.gzMove the executable to
usr/local/binso it is accessible throughout the system.sudo mv node_exporter-1.5.0.linux-amd64/node_exporter /usr/local/bin(Optional) Remove any remaining files.
rm -r node_exporter-1.5.0.linux-amd64*There are two ways of running Node Exporter. It can be launched from the terminal using the command
node_exporter. Or, it can be activated as a system service. Running it from the terminal is less convenient. But this might not be a problem if the tool is only intended for occasional use. To run Node Exporter manually, use the following command. The terminal outputs details regarding the statistics collection process.node_exporterIt is more convenient to run Node Exporter as a service. To run Node Exporter this way, first, create a
node_exporteruser.sudo useradd -rs /bin/false node_exporterCreate a service file for
systemctlto use. The file must be namednode_exporter.serviceand should have the following format. Most of the fields are similar to those found inprometheus.service, as described in the previous section.sudo vi /etc/systemd/system/node_exporter.service- File: /etc/systemd/system/node_exporter.service
1 2 3 4 5 6 7 8 9 10 11 12 13 14 15[Unit] Description=Node Exporter Wants=network-online.target After=network-online.target [Service] User=node_exporter Group=node_exporter Type=simple Restart=on-failure RestartSec=5s ExecStart=/usr/local/bin/node_exporter [Install] WantedBy=multi-user.target
(Optional) If you intend to monitor the client on an ongoing basis, use the
systemctl enablecommand to automatically launch Node Exporter at boot time. This continually exposes the system metrics on port9100. If Node Exporter is only intended for occasional use, do not use the command below.sudo systemctl enable node_exporterReload the
systemctldaemon, start Node Exporter, and verify its status. The service should beactive.sudo systemctl daemon-reload sudo systemctl start node_exporter sudo systemctl status node_exporternode_exporter.service - Node Exporter Loaded: loaded (/etc/systemd/system/node_exporter.service; enabled; vendor preset: enabled) Active: active (running) since Tue 2023-04-11 13:48:06 UTC; 4s agoUse a web browser to visit port
9100on the client node, for example,http://local_ip_addr:9100. A page entitledNode Exporteris displayed along with a link readingMetrics. Click theMetricslink and confirm the statistics are being collected. For a detailed explanation of the various statistics, see the Node Exporter Documentation.
How to Configure Prometheus to Monitor Client Nodes
The client nodes are now ready for monitoring. To add clients to prometheus.yml, follow the steps below:
On the monitoring server running Prometheus, open
prometheus.ymlfor editing.sudo vi /etc/prometheus/prometheus.ymlLocate the section entitled
scrape_configs, which contains a list of jobs. It currently lists a single job namedprometheus. This job monitors the local Prometheus task on port9090. Beneath theprometheusjob, add a second job having thejob_nameofremote_collector. Include the following information.- A
scrape_intervalof10s. - Inside
static_configsin thetargetsattribute, add a bracketed list of the IP addresses to monitor. Separate each entry using a comma. - Append the port number
:9100to each IP address. - To enable monitoring of the local server, add an entry for
localhost:9100to the list.
The entry should resemble the following example. Replace
remote_addrwith the actual IP address of the client.- File: /etc/prometheus/prometheus.yml
1
2
3
4
5
... - job_name: "remote_collector" scrape_interval: 10s static_configs: - targets: ["remote_addr:9100"]
- A
To immediately refresh Prometheus, restart the
prometheusservice.sudo systemctl restart prometheusUsing a web browser, revisit the Prometheus web portal at port
9090on the monitoring server. Select Status and then Targets. A second link for theremote_collectorjob is displayed, leading to port9100on the client. Click the link to review the statistics.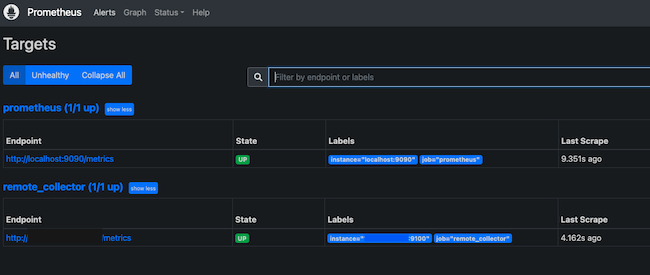
How to Install and Deploy the Grafana Server
Prometheus is now collecting statistics from the clients listed in the scrape_configs section of its configuration file. However, the information can only be viewed as a raw data dump. The statistics are difficult to read and not too useful.
Grafana provides an interface for viewing the statistics collected by Prometheus. Install Grafana on the same server running Prometheus and add Prometheus as a data source. Then install one or more panels for interpreting the data. To install and configure Grafana, follow these steps.
Install some required utilities using
apt.sudo apt-get install -y apt-transport-https software-properties-commonImport the Grafana GPG key.
sudo wget -q -O /usr/share/keyrings/grafana.key https://apt.grafana.com/gpg.keyAdd the Grafana “stable releases” repository.
echo "deb [signed-by=/usr/share/keyrings/grafana.key] https://apt.grafana.com stable main" | sudo tee -a /etc/apt/sources.list.d/grafana.listUpdate the packages in the repository, including the new Grafana package.
sudo apt-get updateInstall the open-source version of Grafana.
Note To install the Enterprise edition of Grafana, use the commandsudo apt-get install grafana-enterpriseinstead.sudo apt-get install grafanaReload the
systemctldaemon.sudo systemctl daemon-reloadEnable and start the Grafana server. Using
systemctl enableconfigures the server to launch Grafana when the system boots.sudo systemctl enable grafana-server.service sudo systemctl start grafana-serverVerify the status of the Grafana server and ensure it is in the
activestate.sudo systemctl status grafana-servergrafana-server.service - Grafana instance Loaded: loaded (/lib/systemd/system/grafana-server.service; enabled; vendor preset: enabled) Active: active (running) since Tue 2023-04-11 17:31:53 UTC; 9s ago
How to Integrate Grafana and Prometheus
All system components are now installed, but Grafana and Prometheus are not set up to interact. The remaining configuration tasks, including adding Prometheus as the data source and importing a dashboard panel, can be accomplished using the Grafana web interface.
To integrate Grafana and Prometheus, follow the steps below:
Using a web browser, visit port
3000of the monitoring server. For example, enterhttp://local_ip_addr:3000, replacinglocal_ip_addrwith the actual IP address. Grafana displays the login page. Use the user nameadminand the default passwordpassword. Change the password to a more secure value when prompted to do so.
After a successful password change, Grafana displays the Grafana Dashboard.
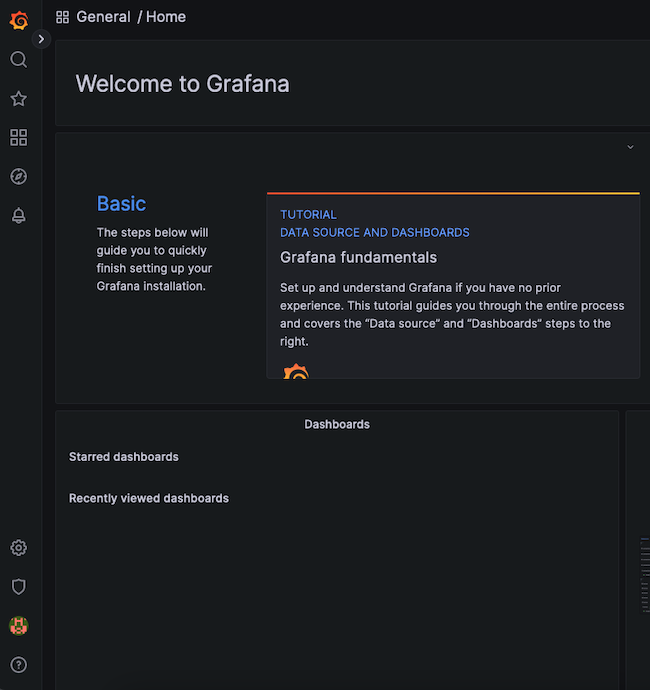
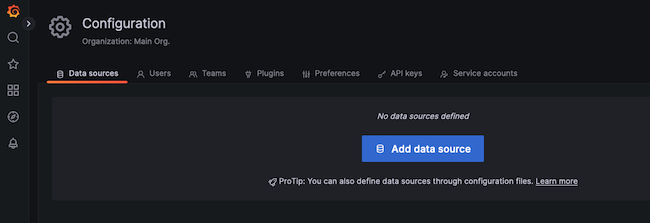
To add Prometheus as a data source, click the gear symbol, standing for Configuration, then select Data Sources.
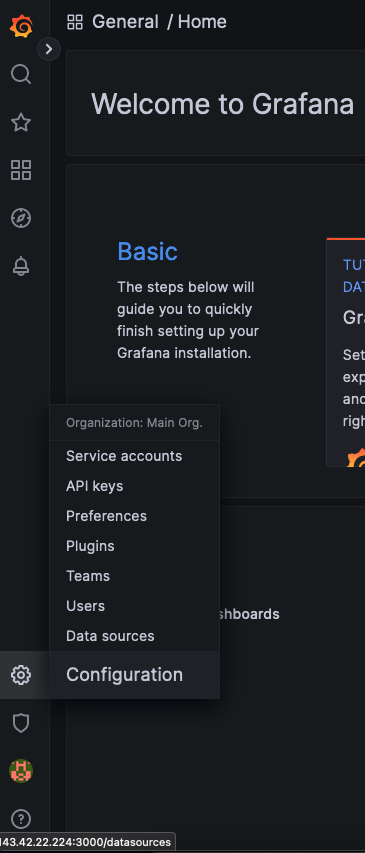
At the next display, click the Add data source button.
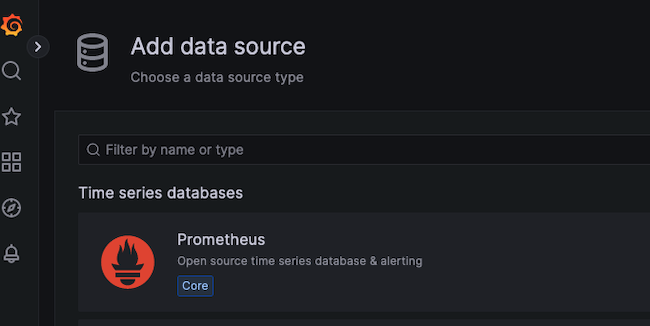
Choose Prometheus as the data source.
For a local Prometheus source, as described in this guide, set the URL to
http://localhost:9090. Most of the other settings can remain at the default values. However, a non-defaultTimeoutvalue can be added here.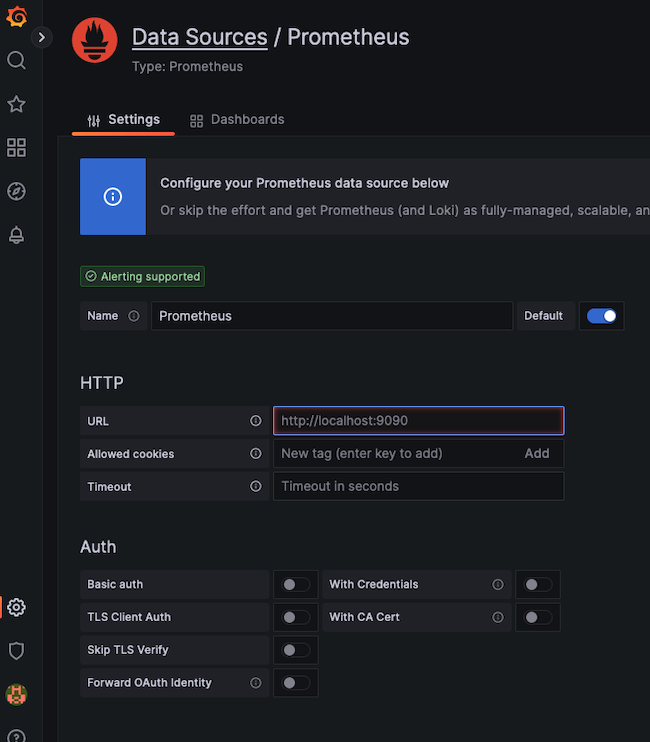
When satisfied with the settings, select the Save & test button at the bottom of the screen.
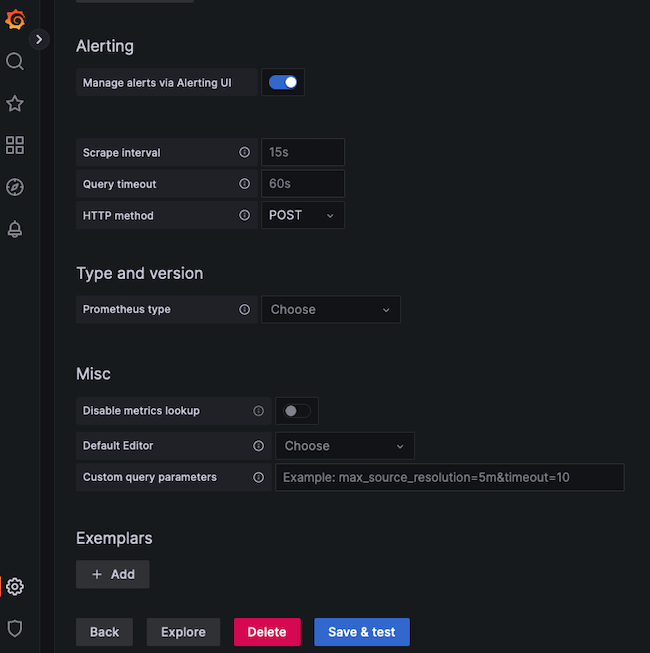
If all settings are correct, Grafana confirms the
Data source is working.
How to Import a Grafana Dashboard
A dashboard displays statistics for the client node using a more effective and standardized layout. It is certainly possible to create a custom dashboard. However, Prometheus has already created a dashboard to support the Node Exporter statistics. The Node Exporter Full dashboard neatly graphs most of the values collected from the client nodes. It is much less work to import this premade dashboard than to create a custom one.
To import the Node Exporter dashboard, follow the steps below:
Visit the Grafana Dashboard Library. Enter
Node exporteras the search term.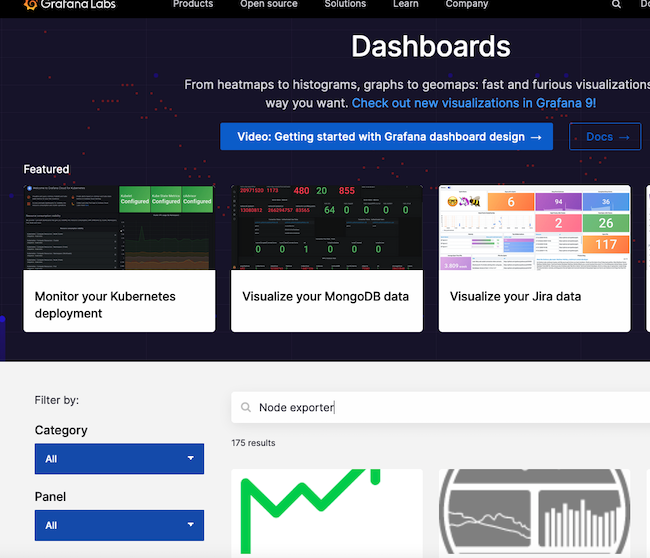
Select the entry for
Node Exporter Full.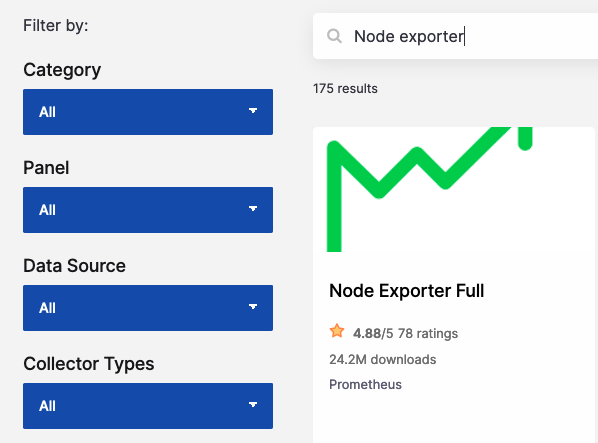
Make a note of the ID number or use the button to copy the ID to the clipboard. The ID of this board is currently
1860.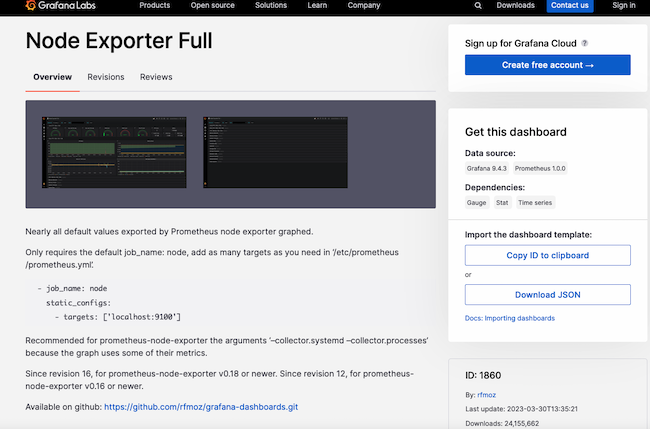
Return to the Grafana dashboard. Select the Dashboard icon, consisting of four squares, and choose + Import.
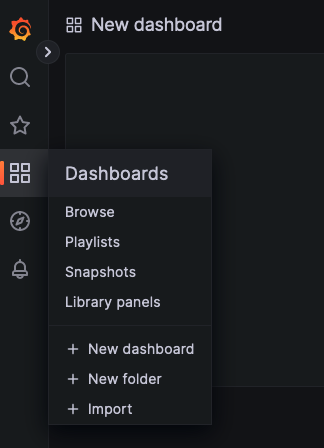
In the Import via grafana.com box, enter the ID
1860from the previous step. Then select the Load button.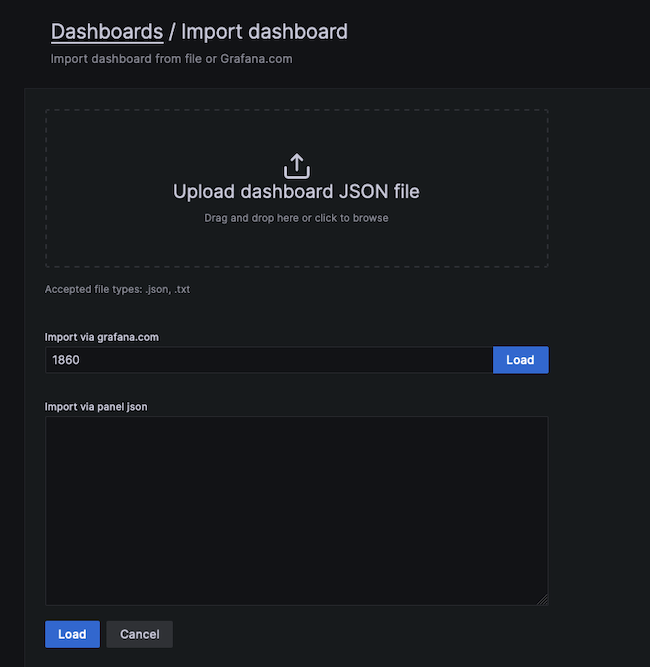
At the next screen, confirm the import details. Choose
Prometheusas the data source and click the Import button.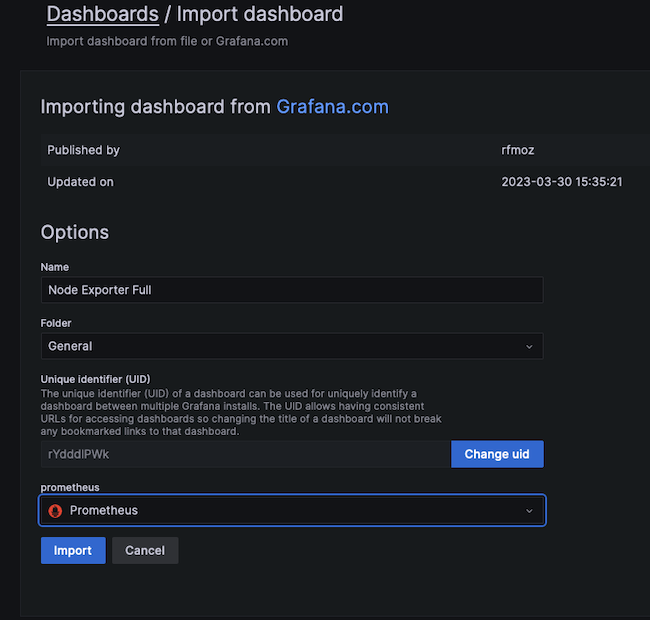
The
Node Exporter Fulldashboard takes effect immediately. It displays the performance metrics and state of the client node, including the Memory, RAM, and CPU details. Several drop-down menus at the top of the screen allow users to select the host to observe and the time period to highlight.The following example demonstrates how a client reacts when stressed by a demanding Python program. The
CPU Busywidget indicates how the CPU is pinned near the maximum. If this occurs during normal operating conditions, it potentially indicates more CPU power is required.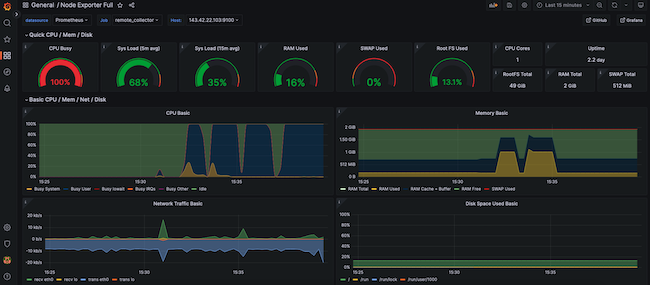
Conclusion
Prometheus is a system monitoring application that polls client systems for key metrics. Each client node must use an exporter to collect and expose the requested data. Prometheus is most effective when used together with the Grafana visualization tool. Grafana imports the metrics from Prometheus and presents them using an intuitive dashboard structure.
To integrate the components, download and install Prometheus on a central server and configure Prometheus as a service. Install the Prometheus Node Exporter on each client to collect the data and configure Prometheus to poll the clients. Install Grafana on the same server as Prometheus and configure Prometheus as a data source. Finally, import a dashboard to display the metrics from the client. For more information on Prometheus, see the Prometheus Overview and Documentation. Grafana can be best understood by reading the Introduction to Grafana.
More Information
You may wish to consult the following resources for additional information on this topic. While these are provided in the hope that they will be useful, please note that we cannot vouch for the accuracy or timeliness of externally hosted materials.
- Grafana Labs
- Grafana Dashboard Library
- Grafana Documentation
- Introduction to Grafana
- Prometheus
- Prometheus Tutorials
- Prometheus Overview and Documentation
- Prometheus Downloads Page
- Prometheus GitHub page
- Node Exporter GitHub page
- Node Exporter Documentation
- Node Exporter Full Grafana Dashboard
- How to build a Dashboard in Grafana
This page was originally published on

